What will happen when after an ICH? A summary of the current state of prediction models

Figure 2 from the paper, showing the number of prognostic models that use a certain combination of outcome (rows) and the timing of outcome assessment (columns)

The question seems to be straightforward: “what bad stuff happens when after somebody develops an intracerebral hemorrhage, and how will I know whether that will also happen to me now that I have one”? The answer is, as always, “it depends”. It depends on how you actually specify the question. What does “bad stuff” mean? Which “when” are you interested? And what are your personal risk factors? We need all this information in order to get an answer from a clinical prediction model.

The thing is, we also need a good working clinical prediction model – that is it should distinguish those who develop the bad stuff from those who don’t, but it should also make sure that the absolute risks are about right. This new paper (project carried by JW) discusses all ins and outs when it comes to the current state of affairs when it comes to predictions. Written for neurologist, some of these comments and points that we rise will not be new to methodologists. But as it is not a given that methodologist will be involved somebody decides that a new prediction model needs to be developed, we wrote it all in up in this review.

The paper, publishes in Neurological Research and Practice, has a couple of messages:

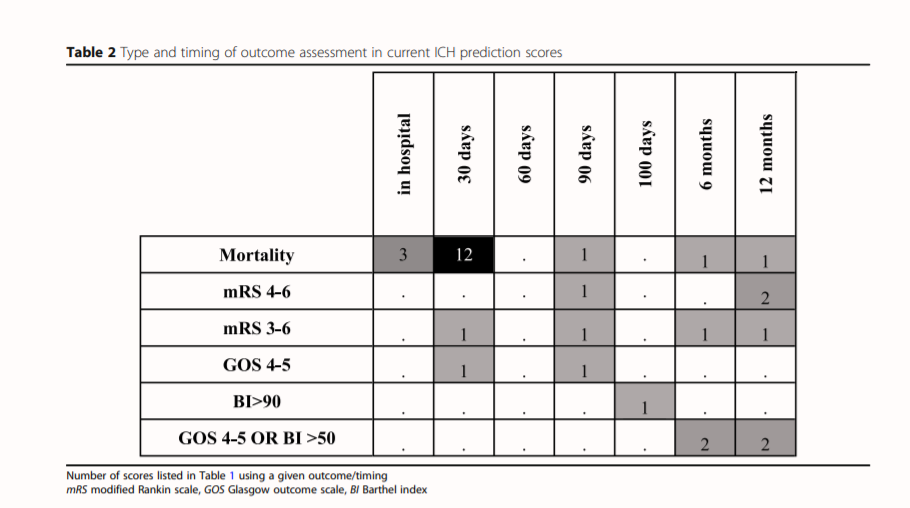
  • The number of existing prediction models for this disease is already quite big – and the complexity of the models seem to increase overtime, without a clear indication that the performance of these models gets better. A lot of these models use different definitions for the type of outcome, as well as the moment that the outcome is assessed – all leading to wildly different models, which are difficult to compare.
  • The statistical workup is limited: The performance is often only measured in a simple AUC- calibration and net benefit is not reported on. Even more worryingly, external validation not always possible, as the original publications do not provide point estimates.
  • Given the severity of the disease, the so-called “withdrawal of care bias” is an important element when thinking and talking about prognostic scores. This bias, in which those with a bad score do not receive treatment can lead to a self-fulfilling prophecy type of situation in the clinic, captured in the data.

In short – when you think you want to develop a new model, think again. Think long and hard. Identify why the current models are working or are not working. Can you improve? Do you have the insights and skill set to do so? Really? If you think so, please do so, but just don’t add another not so useful prediction model to the already saturated literature.

New paper: Long-Term Mortality Among ICU Patients With Stroke Compared With Other Critically Ill Patients

Stroke patients can be severely affected by the clot or bleed in their brain. With the emphasis on “can”, because the clinical picture of stroke is varied. The care for stroke cases is often organized in stroke units, specialized wards with the required knowledge and expertise. I forgot who it was – and I have not looked for any literature to back this up – but a MD colleague told me once that stroke units are the best “treatment” for stroke patients.

Why am I telling you this? Because the next paper I want to share with you is not about mild or moderately affected patients, nor is it about the stroke unit. It is about stroke patients who end up at the intensive care unit. Only 1 in 50 to 100 of ICU patients are actually suffering from stroke, so it is clear that these patients do not make up the bulk of the patient population. So, all the more reason to bring some data together and get a better grip on what actually happens with these patients.

That is what we did in the paper “Long-Term Mortality Among ICU Patients With Stroke Compared With Other Critically Ill Patients”. The key element of the paper is the sheer volume of data that were available to study this group: 370,386 ICU patients, of which 7,046 (1.9%) stroke patients (of which almost 40% with intracerebral hemorrhage, a number far higher than natural occurrence).

The results are basically best summed up in the Kaplan Meier found below – it shows that in the short run, the risk of death is quite high (this is after all an ICU population), but also that there is a substantial difference between ischemic and hemorrhagic stroke. Hidden in the appendix are similar graphs where we plot also different diseases (e.g. traumatic brain injury, sepsis, cardiac surgery) that are more prevalent in the ICU to provide MDs with a better feel for the data. Next to these KM’s we also model the data to adjust for case-mix, but I will keep those results for those who are interested and actually read the paper.

Source: https://journals.lww.com/ccmjournal/Fulltext/2020/10000/Long_Term_Mortality_Among_ICU_Patients_With_Stroke.30.aspx

Our results are perhaps not the most world shocking, but it is helpful for the people working in the ICU’s, because they get some more information about the patients that they don’t see that often. This type of research is only possible if there is somebody collecting this type of data in a standardized way – and that is where NICE came in. “National Intensive Care Evaluation” is a Dutch NGO that actually does this. Nowadays, most people know this group from the news when they give/gave updates on the number of COVID-19 patients in the ICU in the Netherlands. This is only possible because there was this infrastructure already in place.

MKV took the lead in this paper, which was published in the journal Critical Care Medicine with DOI: 10.1097/CCM.0000000000004492.

Three new papers published – part II

In my last post, I explained why I am at the moment not writing one post per new paper. Instead, I group them. This time with a common denominator, namely the role of cardiac troponin and stroke:

High-Sensitivity Cardiac Troponin T and Cognitive Function in Patients With Ischemic Stroke. This paper finds its origins in the PROSCIS study, in which we studied other biomarkers as well. In fact, there is a whole lot more coming. The analyses of these longitudinal data showed a – let’s say ‘medium-sized’ – relationship between cardiac troponin and cognitive function. A whole lot of caveats – a presumptive learning curve, not a big drop in cognitive function to work with anyway. After all, these are only mild to moderately affected stroke patients.

Association Between High-Sensitivity Cardiac Troponin and Risk of Stroke in 96 702 Individuals: A Meta-Analysis. This paper investigates several patient populations -the general population, increased risk population, and stroke patients. The number of patients individuals in the title might, therefore, be a little bit deceiving – I think you should really only look at the results with those separate groups in mind. Not only do I think that the biology might be different, the methodological aspects (e.g. heterogeneity) and interpretation (relative risks with high absolute risks) are also different.

Response by Siegerink et al to Letter Regarding Article, “Association Between High-Sensitivity Cardiac Troponin and Risk of Stroke in 96 702 Individuals: A Meta-Analysis”. We did the meta-analysis as much as possible “but the book”. We pre-registered our plan and published accordingly. This all to discourage ourselves (and our peer reviewers) to go and “hunt for specific results”. But then there was a letter to the editor with the following central point: Because in the subgroup of patients with material fibrillation, the cut-offs used for the cardiac troponin are so different that pooling these studies together in one analysis does not make sense. At first glance, it looks like the authors have a point: it is difficult to actually get a very strict interpretation from the results that we got. This paper described our response. Hint: upon closer inspection, we do not agree and make a good counterargument (at least, that’s what we think).

On the value of data – routinely vs purposefully

I listen to a bunch of podcasts, and the podcast “The Pitch” is one of them. In that podcast, Entrepreneurs of start-up companies pitch their ideas to investors. Not only is it amusing to hear some of these crazy business ideas, but the podcast also help me to understand about professional life works outside of science. One thing i learned is that it is ok if not expected, to oversell by about a factor 142.

Another thing that I learned is the apparent value of data. The value of data seems to be undisputed in these pitches. In fact, the product or service the company is selling or providing is often only a byproduct: collecting data about their users which subsequently can be leveraged for targeted advertisement seems to be the big play in many start-up companies.

I think this type of “value of data” is what it is: whatever the investors want to pay for that type of data is what it is worth. But it got me thinking about the value of data that we actually collect in medical. Let us first take a look at routinely data, which can be very cheap to collect. But what is the value of the data? The problem is that routinely collected data is often incomplete, rife with error and can lead to enormous biases – both information bias as well as selection bias. Still, some research questions can be answered with routinely collected data – as long as you make some real efforts to think about your design and analyses. So, there is value in routinely collected data as it can provide a first glance into the matter at hand.

And what is the case for purposefully collected data? The idea behind this is that the data is much more reliable: trained staff collects data in a standardised way resulting in datasets without many errors or holes. The downside is the “purpose” which often limits the scope and thereby the amount collected data per included individual. this is the most obvious in randomised clinical trials in which often millions of euro’s are spent to answer one single question. Trials often do no have the precision to provide answers to other questions. So it seems that the data can lose it value after answering that single question.

Luckily, many efforts were made to let purposefully collected keep some if its value even after they have served their purpose. Standardisation efforts between trials make it now possible to pool the data and thus obtain a higher precision. A good example from the field of stroke research is the VISTA collaboration, i.e the Virtual International Stroke Trials Archive”. Here, many trials – and later some observational studies – are combined to answer research questions with enough precision that otherwise would never be possible. This way we can answer questions with high quality of purposefully collected data with numbers otherwise unthinkable.

This brings me to a recent paper we published with data from the VISTA collaboration: “Early in-hospital exposure to statins and outcome after intracerebral haemorrhage”. The underlying question whether and when statins should be initiated / continued after ICH is clinically relevant but also limited in scope and impact, so is it justified to start a trial? We took the the easier and cheaper solution and analysed the data from VISTA. We conclude that

… early in-hospital exposure to statins after acute ICH was associated with better functional outcome compared with no statin exposure early after the event. Our data suggest that this association is particularly driven by continuation of pre-existing statin use within the first two days after the event. Thus, our findings provide clinical evidence to support current expert recommendations that prevalent statin use should be continued during the early in-hospital phase.1921

link

And this shows the limitations of even well collected data from RCT: as long as the exposure of interest is potentially provided to a certain subgroup (i.e. Confounding by indication), you can never really be certain about the treatment effects. To solve this, we would really need to break the bond between exposure and any other clinical characteristic, i.e. randomize. That remains the golden standard for intended effects of treatments. Still, our paper provided a piece of the puzzle and gave more insight, form data that retained some of its value due to standardisation and pooling. But there is no dollar value that we can put on the value of medical research data – routinely or purposefully collected alike- as it all depends on the question you are trying to answer.

Our paper, with JD in the lead, was published last year in the European Stroke Journal, and can be found here as well as on my Publons profile and Mendeley profile.

Kuopio Stroke Symposium

Kuopio in summer

Every year there is a Neurology symposium organized in the quiet and beautiful town of Kuopio in Finland. Every three years, just like this year, the topic is stroke and for that reason, I was invited to be part of the faculty. A true honor, especially if you consider the other speakers on the program who all delivered excellent talks!

But these symposia are much more than just the hard cold science and prestige. It is also about making new friends and reconnecting with old ones. Leave that up to the Fins, whose decision to get us all on a boat and later in a sauna after a long day in the lecture hall proved to be a stroke of genius.

So, it was not for nothing that many of the talks boiled down to the idea that the best science is done with friends – in a team. This is true for when you are running a complex international stroke rehabilitation RCT, or you are investigating whether the lower risk in CVD morbidity and mortality amongst frequent sauna visitors. Or, in my case, about the role of hypercoagulability in young stroke – pdf of my slides can be found here –

New paper: Contribution of Established Stroke Risk Factors to the Burden of Stroke in Young Adults

2017-06-16 09_26_46-Contribution of Established Stroke Risk Factors to the Burden of Stroke in Young2017-06-16 09_25_58-Contribution of Established Stroke Risk Factors to the Burden of Stroke in Young

Just a relative risk is not enough to fully understand the implications of your findings. Sure, if you are an expert in a field, the context of that field will help you to assess the RR. But if ou are not, the context of the numerator and denominator is often lost. There are several ways to work towards that. If you have a question that revolves around group discrimination (i.e. questions of diagnosis or prediction) the RR needs to be understood in relation to other predictors or diagnostic variables. That combination is best assessed through the added discriminatory value such as the AUC improvement or even more fancy methods like reclassification tables and net benefit indices. But if you are interested in are interested in a single factor (e.g. in questions of causality or treatment) a number needed to treat (NNT) or the Population Attributable Fraction can be used.

The PAF has been subject of my publications before, for example in these papers where we use the PAF to provide the context for the different OR of markers of hypercoagulability in the RATIO study / in a systematic review. This paper is a more general text, as it is meant to provide in insight for non epidemiologist what epidemiology can bring to the field of law. Here, the PAF is an interesting measure, as it has relation to the etiological fraction – a number that can be very interesting in tort law. Some of my slides from a law symposium that I attended addresses these questions and that particular Dutch case of tort law.

But the PAF is and remains an epidemiological measure and tells us what fraction of the cases in the population can be attributed to the exposure of interest. You can combine the PAF to a single number (given some assumptions which basically boil down to the idea that the combined factors work on an exact multiplicative scale, both statistically as well as biologically). A 2016 Lancet paper, which made huge impact and increased interest in the concept of the PAF, was the INTERSTROKE paper. It showed that up to 90% of all stroke cases can be attributed to only 10 factors, and all of them modifiable.

We had the question whether this was the same for young stroke patients. After all, the longstanding idea is that young stroke is a different disease from old stroke, where traditional CVD risk factors play a less prominent role. The idea is that more exotic causal mechanisms (e.g. hypercoagulability) play a more prominent role in this age group. Boy, where we wrong. In a dataset which combines data from the SIFAP and GEDA studies, we noticed that the bulk of the cases can be attributed to modifiable risk factors (80% to 4 risk factors). There are some elements with the paper (age effect even within the young study population, subtype effects, definition effects) that i wont go into here. For that you need the read the paper -published in stroke- here, or via my mendeley account. The main work of the work was done by AA and UG. Great job!

Advancing prehospital care of stroke patients in Berlin: a new study to see the impact of STEMO on functional outcome

There are strange ambulances driving around in Berlin. They are the so-called STEMO cars, or Stroke Einsatz Mobile, basically driving stroke units. They have the possibility to make a CT scan to rule out bleeds and subsequently start thrombolysis before getting to the hospital. A previous study showed that this descreases time to treatment by ~25 minutes. The question now is whether the patients are indeed better of in terms of functional outcome. For that we are currently running the B_PROUD study of which we recently published the design here.

The paradox of the BMI paradox

2016-10-19-17_52_02-physbe-talk-bs-pdf-adobe-reader

I had the honor to be invited to the PHYSBE research group in Gothenburg, Sweden. I got to talk about the paradox of the BMI paradox. In the announcement abstract I wrote:

“The paradox of the BMI paradox”
Many fields have their own so-called “paradox”, where a risk factor in certain
instances suddenly seems to be protective. A good example is the BMI paradox,
where high BMI in some studies seems to be protective of mortality. I will
argue that these paradoxes can be explained by a form of selection bias. But I
will also discuss that these paradoxes have provided researchers with much
more than just an erroneous conclusion on the causal link between BMI and
mortality.

I first address the problem of BMI as an exposure. Easy stuff. But then we come to index even bias, or collider stratification bias. and how selections do matter in a recurrence research paradox -like PFO & stroke- or a health status research like BMI- and can introduce confounding into the equation.

I see that the confounding might not be enough to explain all that is observed in observational research, so I continued looking for other reasons there are these strong feelings on these paradoxes. Do they exist, or don’t they?I found that the two sides tend to “talk in two worlds”. One side talks about causal research and asks what we can learn from the biological systems that might play a role, whereas others think with their clinical  POV and start to talk about RCTs and the need for weight control programs in patients. But there is huge difference in study design, RQ and interpretation of results between the studies that they cite and interpret. Perhaps part of the paradox can be explained by this misunderstanding.

But the cool thing about the paradox is that through complicated topics, new hypothesis , interesting findings and strong feelings about the existence of paradoxes, I think that the we can all agree: the field of obesity research has won in the end. and with winning i mean that the methods are now better described, better discussed and better applied. New hypothesis are being generated and confirmed or refuted. All in all, the field makes progress not despite, but because the paradox. A paradox that doesn’t even exist. How is that for a paradox?

All in all an interesting day, and i think i made some friends in Gothenburg. Perhaps we can do some cool science together!

Slides can be found here.

Does d-dimer really improve DVT prediction in stroke?

369
elsevier.com

Good question, and even though thromboprofylaxis is already given according to guidelines in some countries, I can see the added value of a good discriminating prediction rule. Especially finding those patients with low DVT risk might be useful. But using d-dimer is a whole other question. To answer this, a thorough prediction model needs to be set up both with and without the information of d-dimer and only a direct comparison of these two models will provide the information we need.

In our view, that is not what the paper by Balogun et al did. And after critical appraisal of the tables and text, we found some inconsistencies that prohibits the reader from understanding what exactly was done and which results were obtained. In the end, we decided to write a letter to the editor, especially to prevent that other readers to mistakenly take over the conclusion of the authors. This conclusion, being that “D-dimer concentration with in 48 h of acute stroke is independently associated with development of DVT.This observation would require confirmation in a large study.” Our opinion is that the data from this study needs to be analysed properly to justify such an conclusion. One of the key elements in our letter is that the authors never compare the AUC of the model with and without d-dimer. This is needed as that would provide the bulk of the answer whether or not d-dimer should be measured. The only clue we have are the ORs of d-dimer, which range between 3-4, which is not really impressive when it comes to diagnosis and prediction. For more information on this, please check this paper on the misuse of the OR as a measure of interest for diagnosis/prediction by Pepe et al.

A final thing I want to mention is that our letter was the result of a mini-internship of one of the students at the Master programme of the CSB and was drafted in collaboration with our Virchow scholar HGdH from the Netherlands. Great team work!

The letter can be found on the website of Thrombosis Research as well as on my Mendeley profile.


The ECTH 2016 in The Hague

My first conference experience (ISTH 2008, Boston) got me hooked on science. All these people doing the same thing, speaking the same language, and looking to show and share their knowledge. This is true when you are involved in the organisation. Organising the international soccer match at the Olympic stadium in Amsterdam linked to the ISTH 2013 to celebrate the 25th anniversary of the NVTH was fun. But lets not forget the exciting challenge of organising the WEON 2014.

And now, the birth of a new conference, the European Congress of Thrombosis and Hemostasis, which will be held in The Hague in Netherlands (28-30 sept 2016). I am very excited for several reasons: First of all, this conference will fill in the gap of the bi-annual ISTH conferences. Second, I have the honor to help out as the chair of the junior advisory board. Third, the Hague! My old home town!

So, we have 10 months to organise some interesting meetings and activities, primary focussed on the young researchers. Time to get started!

Changing stroke incidence and prevalence

changing stroke population

Lower changing incidences of disease over time do not necessarily mean that the number of patients in care also goes down, as the prevalence of the disease is a function of incidence and mortality. “Death Cures”. Combine this notion with the fact that both the incidence and mortality rates of the different stroke subtypes change different over time, and you will see that the group of patients that suffer from stroke will be quite different from the current one.

I made this picture to accompany a small text on declining stroke incidences which I have written for the newsletter of the Kompetenznetz Schlaganfall. which can be found in this pdf.