This is not about altmetrics. Nor is about the emails you get from colleagues or patients. It is about the impact of a certain risk factor. A single relative risk is meaningless. As it is a ratio, it is dimensionless, and without the context hidden in the numerator and denominator, it can be tricky to interpret results.
Together with JLR I have a paper coming up in which we plead to use one of the many ways one could interpret the impact of your results, and just simply go beyond the simple relative risk. This will be published in RPTH, the relatively new journal of the ISTH, where I also happen to be on the editorial board.
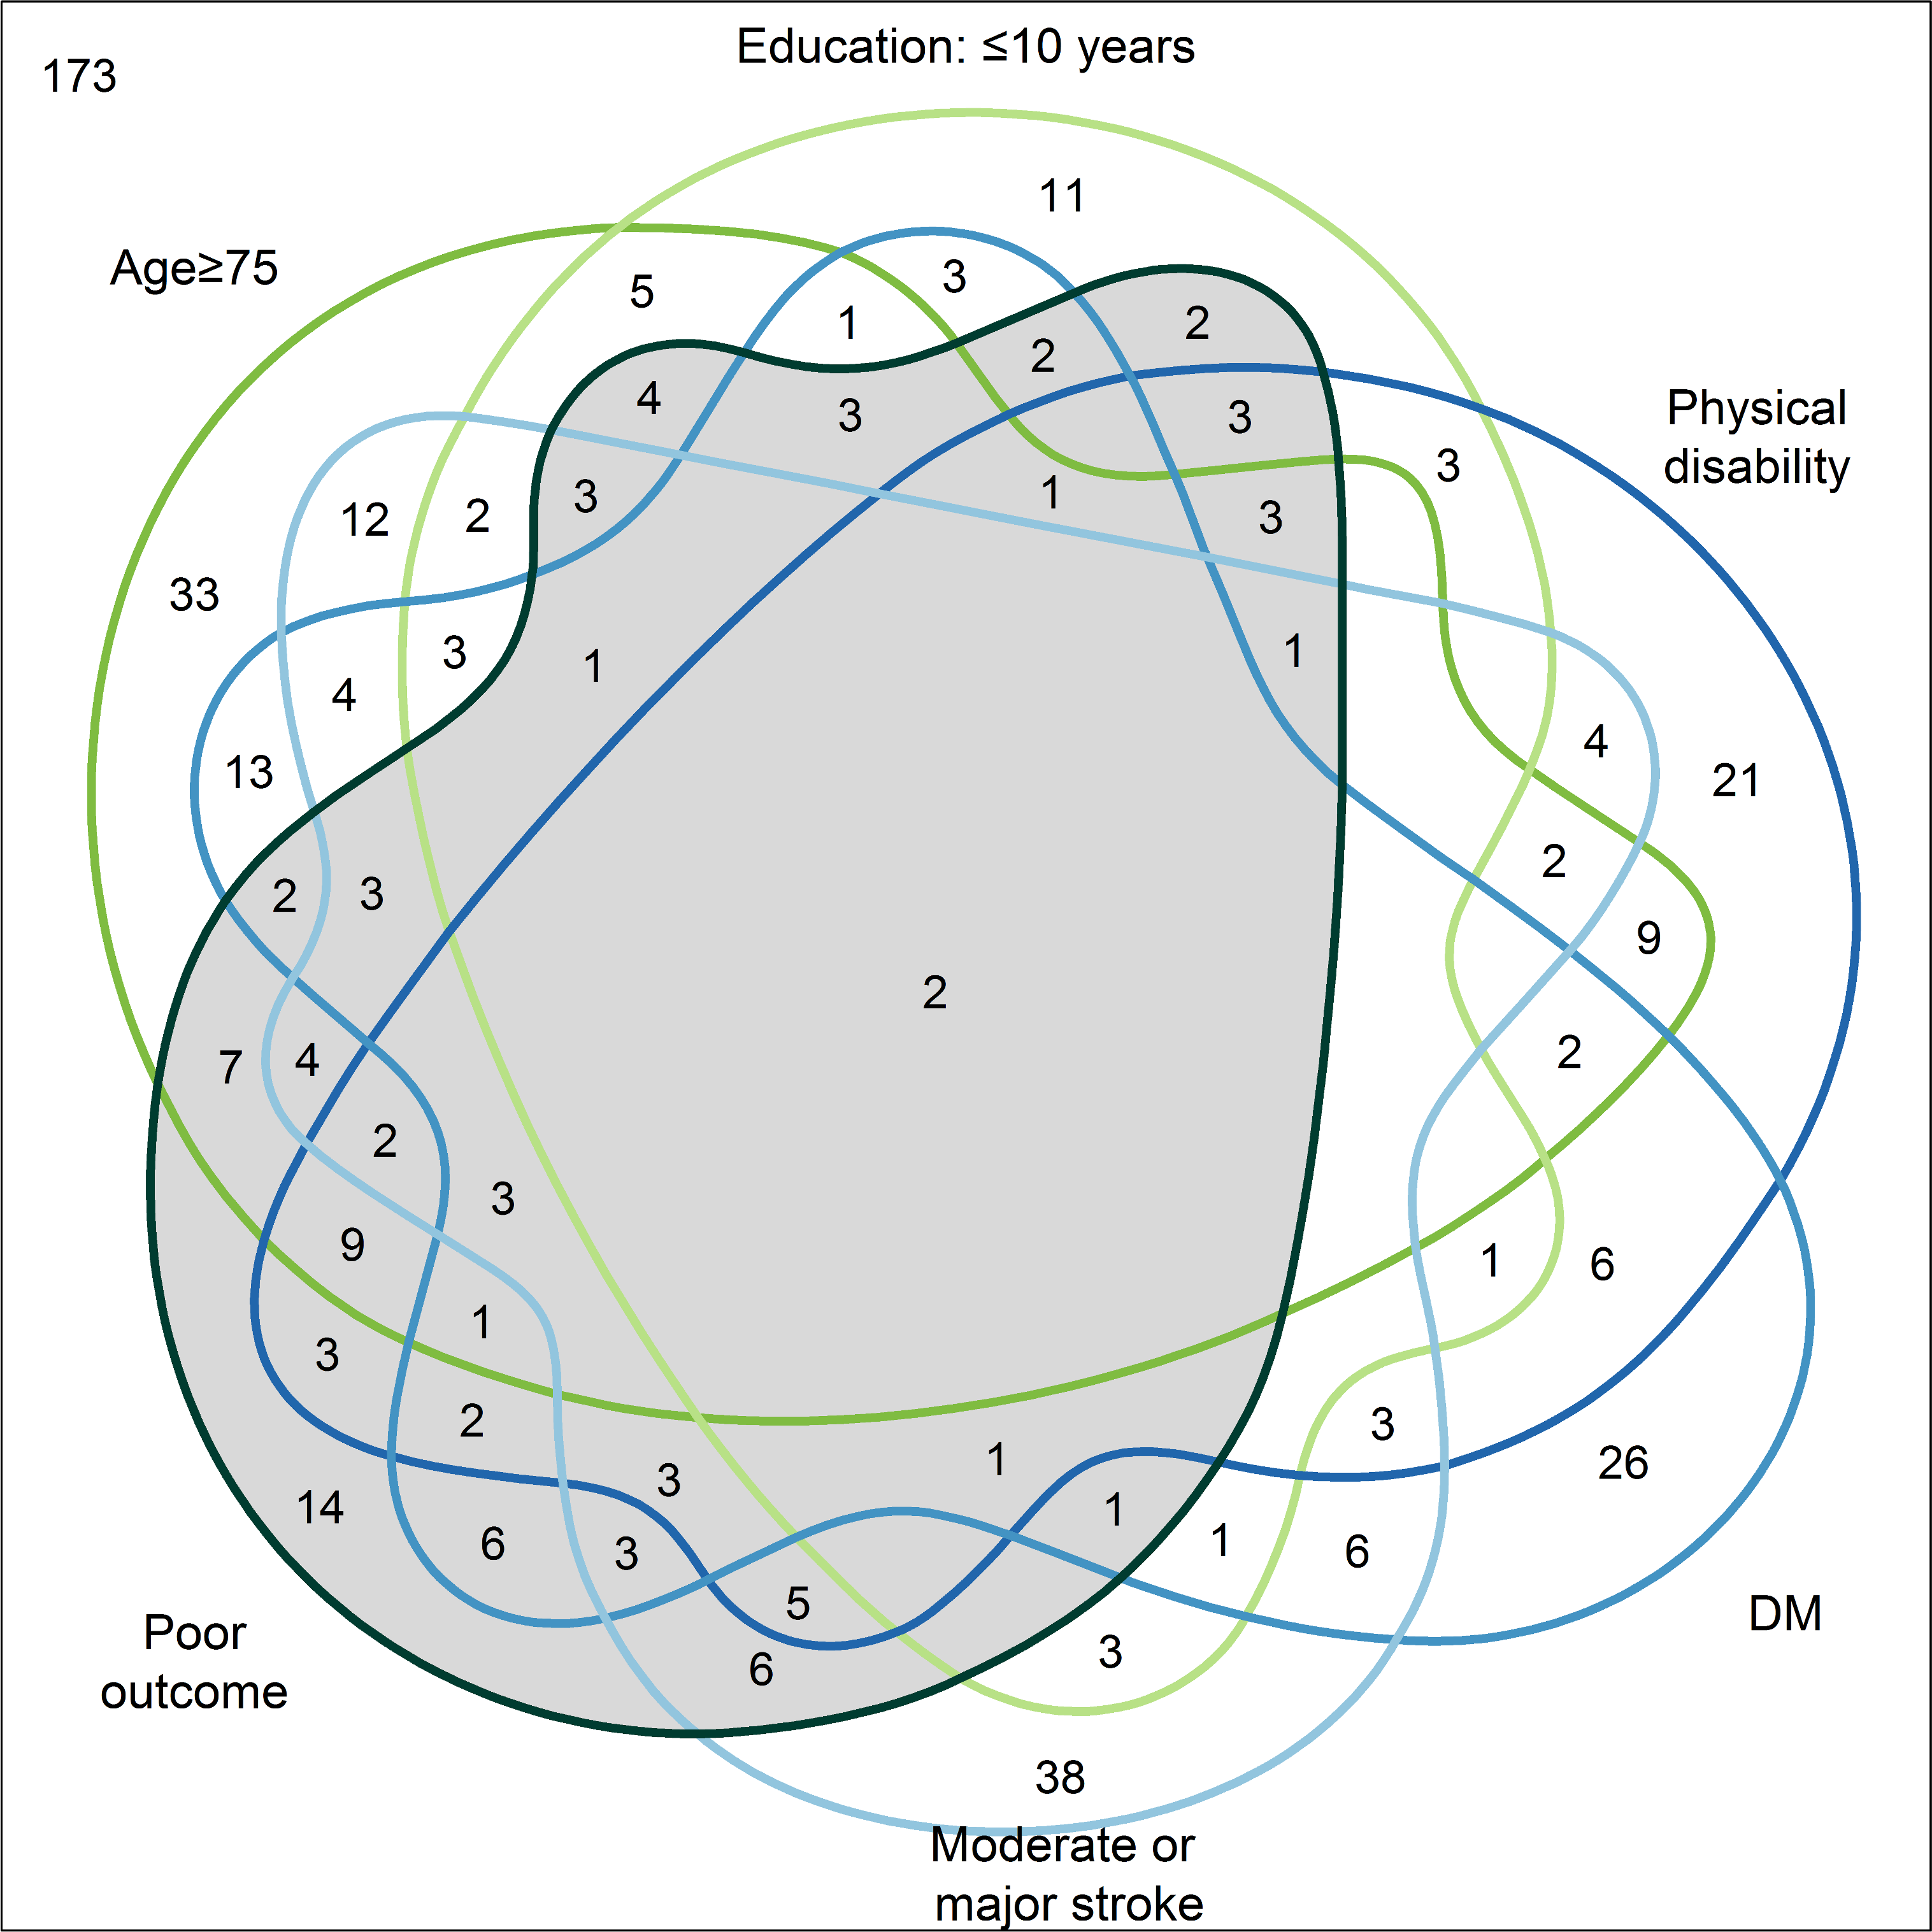
Venn diagram illustrating the intersections of the independent predictors and poor outcome 12 months after stroke. https://doi.org/10.1371/journal.pone.0204285.g003
One of those ways it to report the population attributable risk: the percent of cases which can be attributed to the risk factor in question. It is often said that if we had a magic wand and would use it to make the risk factor disappear X% of the patient will not develop the disease. Some interpret this as the causal fraction, which is not completely correct if you dive really deep into epidemiological theory, but still, you get the idea.
In a paper based on PROSCIS data, with first author CM at the helm, we have tested several ways to calculate the PAR of five well known and established risk factors for bad outcome after stroke. Understanding what lies behind which patient gets has a bad outcome and which doesn’t is one the things we really struggle with, as many patient with well established risk factors just don’t develop a poor outcome. Quantifying the impact of risk factors, and arguably more importantly, ranking the risk factors is a good tool to help MDs, patients, researchers and public health officials to know where to focus on.
However, when we compared the PARs calculated by different methods, we came to the conclusion there is quite some variation. The details are in the table below, but the bottom line is this. It is not a good sign when your results depend on the method. Similar methods should get similar results. But upon closer inspection (and somewhat reassuring) the order of magnitude as well as the rank of the 5 risk factors stays almost similar.
https://doi.org/10.1371/journal.pone.0204285.g003
So, yes, it is possible to measure the impact of your results. These measures do depend on the type of method you have used, which in itself is somewhat worrying, but given that we don’t have magic wand of which we expect to remove a fraction of the disease of up to 2 decimals precise, the PAR is a great tool to get some more grip on the context of RR.
The paper was published in PLOS One and can be found on their website or on my mendeley profile
PS This paper is one of the first papers with patient data in which we provided the data together with the manuscript. From the paper: “The data that support the findings of this study are available to all interested researchers at Harvard Dataverse (https://doi.org/10.7910/DVN/REBNRX).”
Nice.